


In search of the best ramen in town
Avoiding the flaw of a simple average

Lately I’ve fallen in love with Japanese ramen. A quick search on Yelp for the best Japanese ramen in Cambridge returns the following top result:
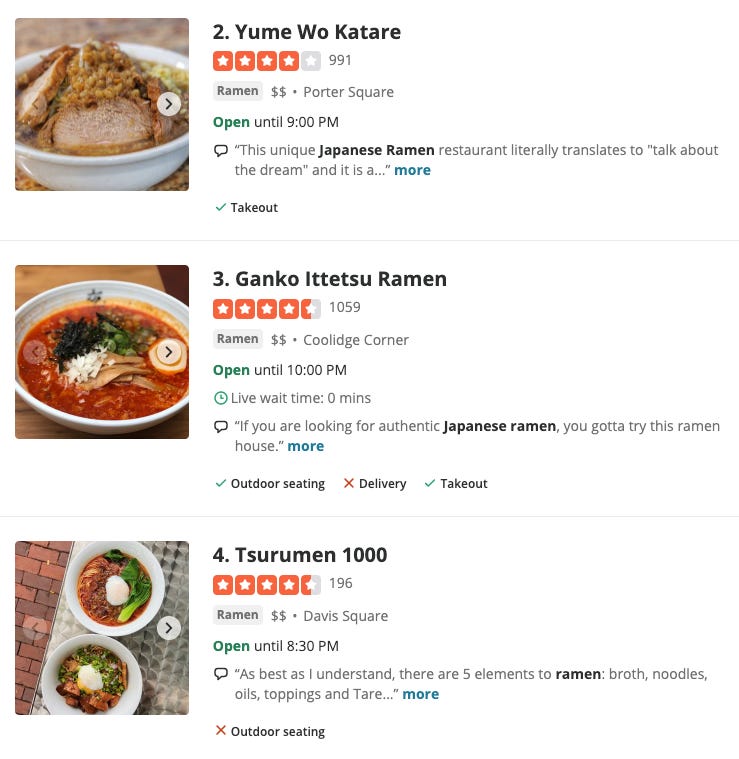
In search of the best ramen place in town, based on this result, I might decide to try Ganko Ittetsu because they have the most number of reviews while their overall Yelp rating seems comparable to that of Tsurumen 1000 (Yelp doesn’t show us the exact rating value upfront).
We know that the overall Yelp rating (on a 5-star scale) is just a simple average of all ratings and does not consider the number of reviews. For restaurants that have more or less the same Yelp rating, how do we systematically choose one over another? How should we evaluate new restaurants with only a few reviews? Intuitively, we’d feel more confident in Yelp ratings based on a lot of reviews. Let’s restrict our attention to the above three restaurants and compare their manually calculated exact Yelp ratings and review distributions1:
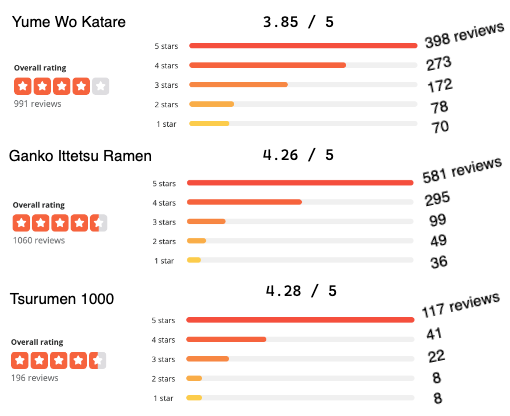
Yume Wo Katare has the lowest Yelp rating out of the three. The overall Yelp rating for Ganko Ittetsu and Tsurumen 1000 are pretty much the same, but the former has many more reviews than the latter. Based solely on ratings, should we change the course and go for Tsurumen? Ultimately, we want to know which restaurant has the highest probability of delivering a 5-star experience.
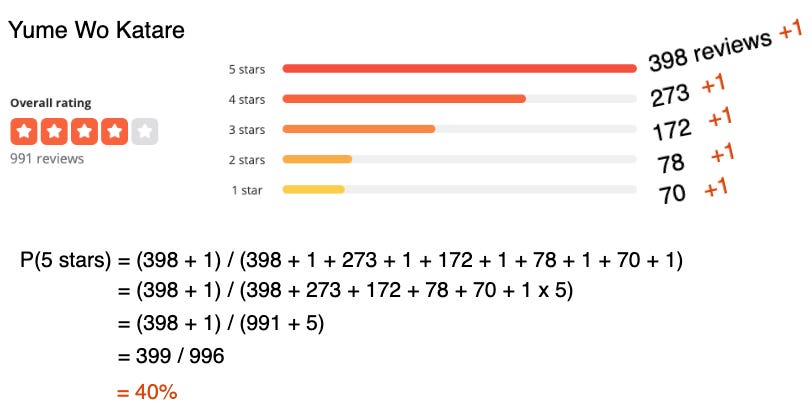
Let’s approach this problem a little differently. Putting my statistician hat on, I’m going to add 1 to all reviews per star level and then calculate the probability of delivering a 5-star experience as the total number of 5 star reviews (399) divided by the total number of reviews after adding 1s (996).
Applying the same calculation to the other two restaurants, we have:
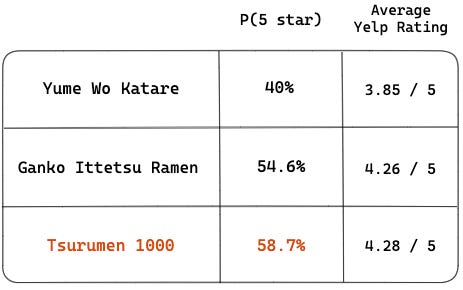
Tsurumen 1000 is the ramen restaurant with the highest probability of delivering a 5-star experience! The difference between their probabilities is larger than the difference in their average Yelp ratings, helping us be more decisive than had we relied only on average ratings and reviews separately.
In our case, all three restaurants had a lot of reviews so the rank order using the probability vs. average Yelp rating are the same, but if we had new restaurants with few reviews, the rank order could change. The probabilities take into account not only the ratings but also the number of reviews.
Why does this work? Adding 1 seems so arbitrary!
Assume that our reviews are generated i.i.d. (independently and identically distributed) from a discrete distribution2 and that our prior is a Dirichlet distribution with parameter alpha where in our case we assume it to be a unit vector of length 5, (1, 1, 1, 1, 1), because there are 5 star level categories. Then given our multinomial likelihood and Dirichlet prior, by Bayes rule, the posterior is also a Dirichlet distribution3 now with parameter N + alpha where N is the vector of total number of reviews per star level.
Given the Dirichlet posterior for Yume Wo Katare below, the probability of a 5-star review is simply the first element 398 + 1 (the posterior count of 5-star reviews) divided by the sum of the vector N + alpha (the total number of reviews) which ends up being 40%.
The magnitude of alpha represents the strength of the prior on data (likelihood). Setting alpha to a small value of 1 means we want to rely on our data to guide our understanding of posterior more so than our prior. You can regard it as “pseudo-counts” that you add to your data. The greater the value of alpha, the stronger the prior has a say in our posterior. Adding 1 to the count at each level also avoids zero division error. If a new restaurant had zero 5-star reviews, for example, by adding 1 to zero, we avoid zero division error when computing the probability of 5-star.
Knowing that Tsurumen 1000 is the best ramen in town, I love their Spicy Tan Tan Ramen and Spicy Maze Soba. Check out my own pics!


To improve our model that summarizes the probabilities of the different star level categories, we could fit a multinomial model and add multiple predictors to it. Everyone has different food preferences, and those preferences may have varying effects on the star ratings of each restaurant.
More on how to do that in future posts if there’s enough interest.
If you want to see more posts like this, I want to know!
Share your anonymous feedback to help shape the topic of my future posts:
About this newsletter
I’m Seong Hyun Hwang, and I’m a data scientist, machine learning engineer, and software engineer. Casual Inference is a newsletter about data science, machine learning, tech startups, management and career, with occasional excursions into other fun topics that come to my mind. All opinions in this newsletter are my own.
I use the term reviews and ratings loosely. Leaving a rating requires writing a review as well.
A common discrete distribution in the case of multiple categories (e.g. 5-star scale) is a multinomial distribution.
The Dirichlet distribution is a conjugate prior for the multinomial distribution so the posterior is also Dirichlet. The benefit of this is that the posterior distribution is easy to compute, giving a closed-form expression, and it more transparently quantifies how much our beliefs (prior distribution) have changed after collecting the data (likelihood).